Study Abstract
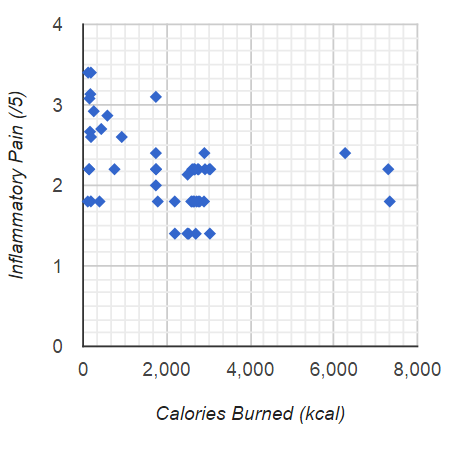
These data suggest with a high degree of confidence (p=0) that Calories Burned (Physical Activity) has a weakly positive predictive relationship (R=-0.544) with Inflammatory Pain (Symptoms). The highest quartile of Inflammatory Pain measurements were observed following an average 900.99kcalCalories Burned. The lowest quartile of Inflammatory Pain measurements were observed following an average 2546.07kcalCalories Burned.
Study Background
In order to reduce suffering through the advancement of human knowledge, I have chosen to share my findings regarding the relationship between Calories Burned and Inflammatory Pain.
 Study Objective
The objective of this study is to determine the nature of the relationship (if any) between the Calories Burned and the Inflammatory Pain. Additionally, we attempt to determine the Calories Burned values most likely to produce optimal Inflammatory Pain values.
Study Design
This study design is consistent with an n=1 observational natural experiment.
Data Analysis
It was assumed that 0 hours would pass before a change in Calories Burned would produce an observable change in Inflammatory Pain. It was assumed that Calories Burned could produce an observable change in Inflammatory Pain for as much as 7 days after the stimulus event.
Data Sources
The QuantiModo platform was used to aggregate data from the data sources.
Calories Burned data was collect using: Bodymedia, Fitbit, Med Helper, MyFitnessPal, MyNetDiary, QuAnTiMo.Do, Up, Up by Jawbone, Withings.
Inflammatory Pain data was collected using: Cardiograph.
Significance Explanation
Using a two-tailed t-test with alpha = 0.05, it was determined that the change in Inflammatory Pain is statistically significant at 95% confidence interval.
Study Limitations
As with any human experiment, it was impossible to control for all potentially confounding variables. The confidence in a causal relationship is bolstered by the fact that time-precedence was taken into account in all calculations. Furthermore, in accordance with the law of large numbers (LLN), the predictive power and accuracy of these results will continually grow over time. 51 paired data points were used in this analysis. Assuming that the relationship is merely coincidental, as the participant independently modifies their Calories Burned values, the observed strength of the relationship will decline until it is below the threshold of significance. Furthermore, it will be very enlightening to aggregate this data with the data from other participants with similar genetic, diseasomic, environmentomic, and demographic profiles.
Study Results
This analysis suggests that HIGHER Calories Burned (Physical Activity) generally predicts LOWER Inflammatory Pain (p = 0). Inflammatory Pain is, on average, 23% HIGHER after around 900.99 Calories Burned. After an onset delay of 168 hours, Inflammatory Pain is, on average, -5% LOWER than its average over the 168 hours following around 2546.07 Calories Burned. 51 data points were used in this analysis. The value for Calories Burned changed 365 times, effectively running 183 separate natural experiments. The top quartile outcome values are preceded by an average 900.99 kcal of Calories Burned. The bottom quartile outcome values are preceded by an average 2546.07 kcal of Calories Burned. Forward Pearson Correlation Coefficient was -0.544 (p=0, 95% CI -0.679 to -0.409 onset delay = 0 hours, duration of action = 168 hours) . The Reverse Pearson Correlation Coefficient was -0.389 (P=0, 95% CI -0.524 to -0.254, onset delay = -0 hours, duration of action = -168 hours). When the Calories Burned value is closer to 900.99 kcal than 2546.07 kcal, the Inflammatory Pain value which follows is, on average, 23% percent higher than its typical value. When the Calories Burned value is closer to 2546.07 kcal than 900.99 kcal, the Inflammatory Pain value which follows is 0% lower than its typical value.
